SharpMaps
Using Python to Create Maps from Scratch
Last updated: 2024/04/22
Maybe Python is not the first tool that comes to mind for creating maps, but then there are also many different types of maps. Broadly speaking, a map as I see it, is a visualization of data, where data can be anything from cities to roads to something like election results by area. Such data, linked to a specific location or area is called geospatial data.
Motivation
Called GIS software, there exist several software solutions for reading, analyzing, transforming and visualizing such data. The most famous examples are the open source QGIS and paid ArcGIS by ESRI. In these tools you can use a graphical user interface to get to your desired results.
For many tasks, especially one-off maps, these tools are probably the most efficient approach and trying to get the same results with Python might be a form of self-torture. That being said, the basic building blocks of working with data, and creating diagrams and graphs are very common use cases for Python in the data science and engineering communities, so it should surely be possible. It might even beneficial in cases where multiple maps need to be generated automatically, or when available data is in weird formats which are not supported out of the box by GIS software.
Also, I have a fascination with generative art, and the process of creating something visual or pretty just by writing code. So this approach should surely scratch that itch.
GeoPandas
The most common starting point to work with geospatial data in Python is called GeoPandas. You might be familiar with Pandas, which introduces a DataFrame object to Python, as an easier way to work with table based datasets. GeoPandas in turn extends the DataFrame to a GeoDataFrame, by adding a new column that is specifically reserved for geometric data. Next to that, it introduces methods to read from typical geospatial data formats, to manipulate these geometric objects, and to visualize the data for which it relies heavily on much older technology.
Behind the scenes
There are three very old, highly optimized C/C++ libraries that power basically all GIS applications and tools, and are also behind GeoPandas.
-
GDAL: As its name implies, the Geospatial Data Abstraction Library is, a toolset to read, write, and convert. At this time more than 200 different data formats are supported.GeoPandasuses the packageFionawhich are the Python bindings toGDAL. In the future this will be replaced with the more recentPyogrio. -
GEOS: This package implements three basic geometry types. Points, lines, and polygons. Furthermore you can do things like adding or subtracting shapes, and calculating properties like lengths, areas and distances. Python bindings are provided throughShapelywhich is again one of the dependencies ofGeoPandas. -
PROJ: Maps can have different coordinate systems and projections as there are many ways to visualize our planet on a flat plane.PROJis hooked intoGeoPandasthrough the packagepyproj.
Using Conda
Since these main dependencies are written in C/C++, their binaries must be installed on the system, outside of the Python environment. To set this up yourself is quite tricky, especially on Windows. An easier way to deal with this is to install Python using Miniconda, as this can install and manage these different non-Python dependencies.
If, like me, you are used to a vanilla Python installation, and using pip to install packages, this requires some adaptation, as it is not recommended to mix pip and conda for package management. After installing Miniconda you can get the required packages by running:
conda install -c conda-forge numpy gdal geopandas pyogrio
On Windows, after everything is installed successfully, you need to make sure that GDAL is set correctly in your path and avoid future warnings, by running the following batch file once:
%userprofile%\miniconda3\etc\conda\activate.d\gdal-activate.bat
And with that you should have everything you need to create your first map using nothing but Python.
Creating your first map
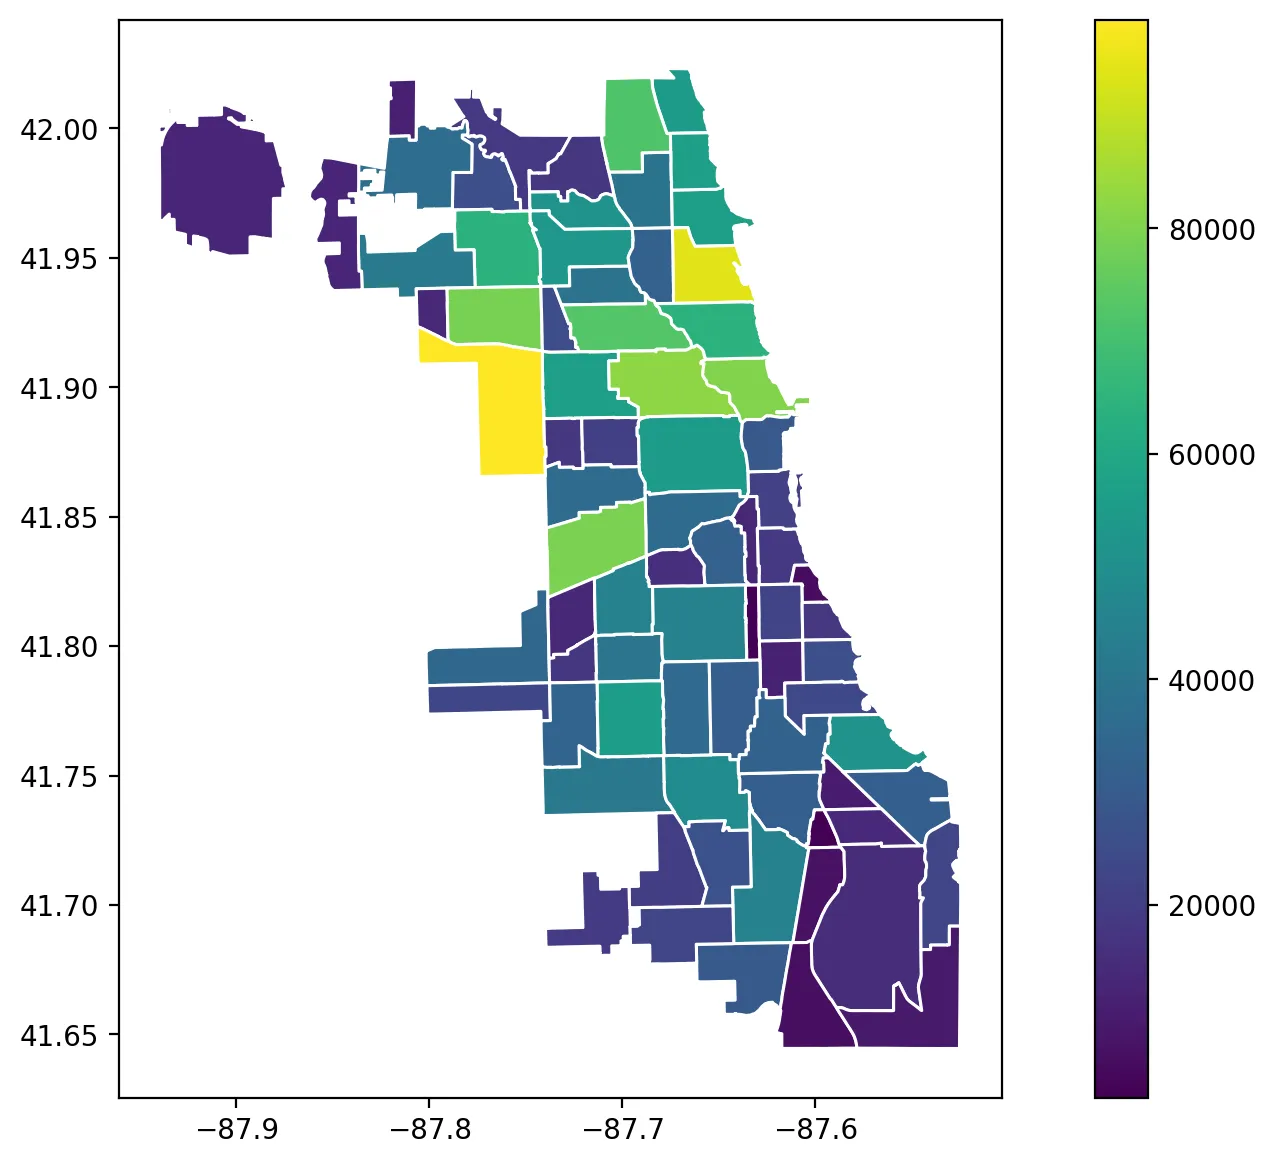
To confirm everything works, you should now be able to run the following, extremely simple script, using GeoPandas to load and plot an open dataset containing population numbers for Chicago.
import geopandas as gpd

data = gpd.read_file('https://geodacenter.github.io/data-and-lab/data/Chi-CCA.zip')

data.plot(column='2010_POP', legend=True)
This code should result in the image below, representing the population in Chicago as a basic and unstyled figure. But hey, it’s our first map!
In future articles we will dive into styling maps using Python, such that the output does not look like a scientific figure, but rather like something worthy of publication.
Follow Me
You can follow me on Instagram, Threads, and X. If you are interested to receive an update whenever I post new content, leave your e-mail address below.