A Map About Chicken
Created on: 2024/05/11
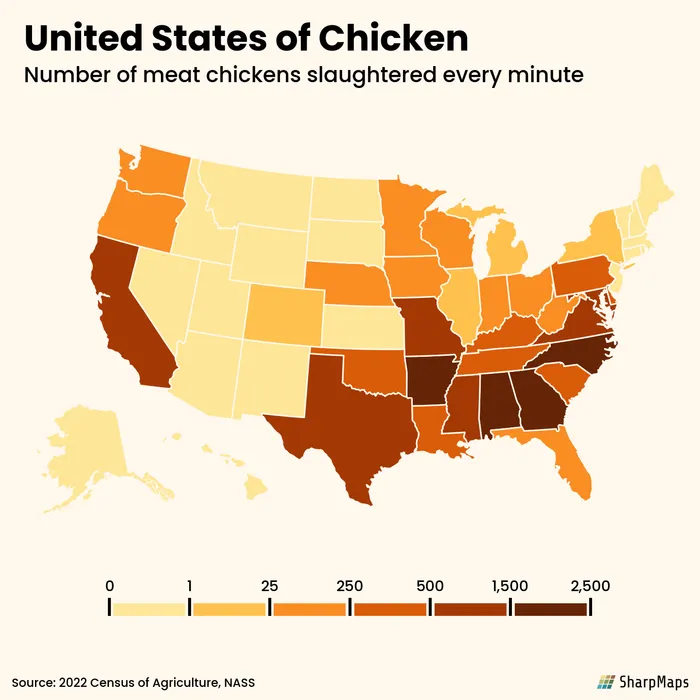
This map is created in pure Python, and inspired by this weeks theme for ‘Map Prompt Monday’, agriculture. The data is sourced from the 2022 Census of Agriculture performed by the United States Department of Agriculture (USDA).
In this dataset, yearly broiler production numbers are given, which are so high as to be meaningless. To make the data easier to understand I calculated the average values for each minute, and carefully selected the most informative set of bins for the colormap.
Follow Me
You can follow me on Instagram, Threads, and X. If you are interested to receive an update whenever I post new content, leave your e-mail address below.