Follow me: ![]()
![]()
![]()
Using OpenStreetMap Data in Your Own Maps
Last updated: 2024/06/06
If you need data to create any kind of map, it is hard to ignore OpenStreetMap as a data source. I am sure you know, but in case you don’t: OpenStreetMap is like Wikipedia but then for the map of our planet. Like Wikipedia, everybody can contribute, make changes, or correct mistakes. All these people and organizations together have created something that is just as complete as Google Maps, and contains practically all roads, footpaths, places, and even buildings in existance.
If you think about the scale of this, to me this dataset is one of the most remarkable open source achievements of all time. In this article I will explain how this data is structured, and different ways of using it in your own project.
Data structure
All data in the OpenStreetMap (OSM) project is one of three types.
-
Node: A point with a single location, such as a restaurant, mountain peak, petrol station, or yes, even an individual tree.
-
Way: A way is a line, which can be anything from a road to a river, but also the outline of a polygon, such as the footprint of a building.
-
Relation: A relation is any combination of nodes, ways, or even other relations. For example a list of line sections that make up the border of an entire country.
Tags
To be able to capture any kind of data into these three types, tags are employed to give the points, ways and relations meaning. For instance the highway tag can be used on a road, to explain the type of road. Just to highlight briefly the challenges in consistent tagging, there are huge articles like this one, discussing how different values of a tag should be used, and how this differs from country to country. Next to the OSM wiki, another good source to explore various tags is the OSM taginfo website.
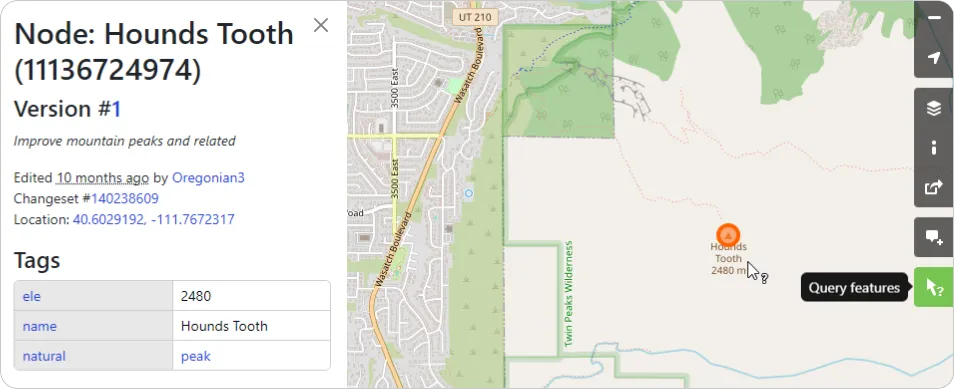
Inspect OSM data
All of this might still sound a bit abstract, so to get a better idea, you can go to openstreetmap.org and use the ‘query features’ button as shown below. With the help of this tool you can browse and explore all of the OSM data.
Query OSM data with the Overpass API
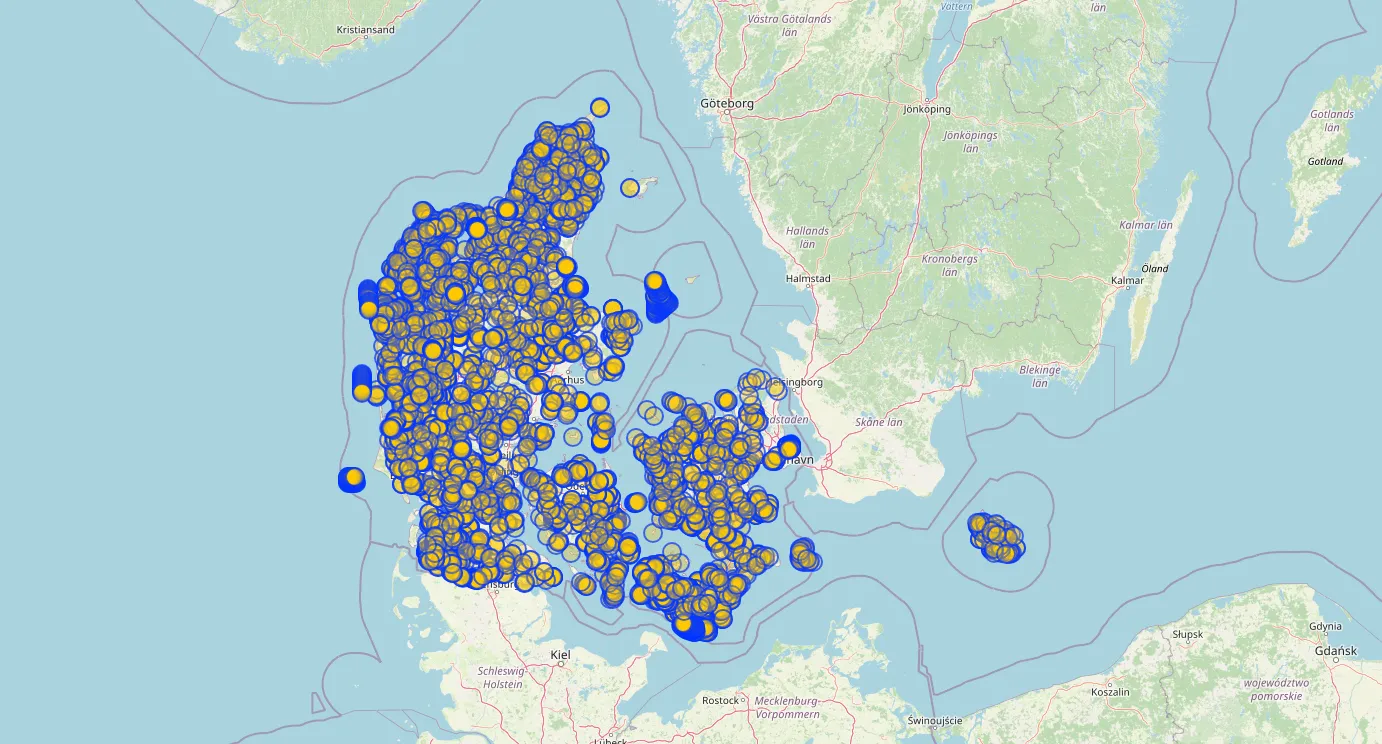
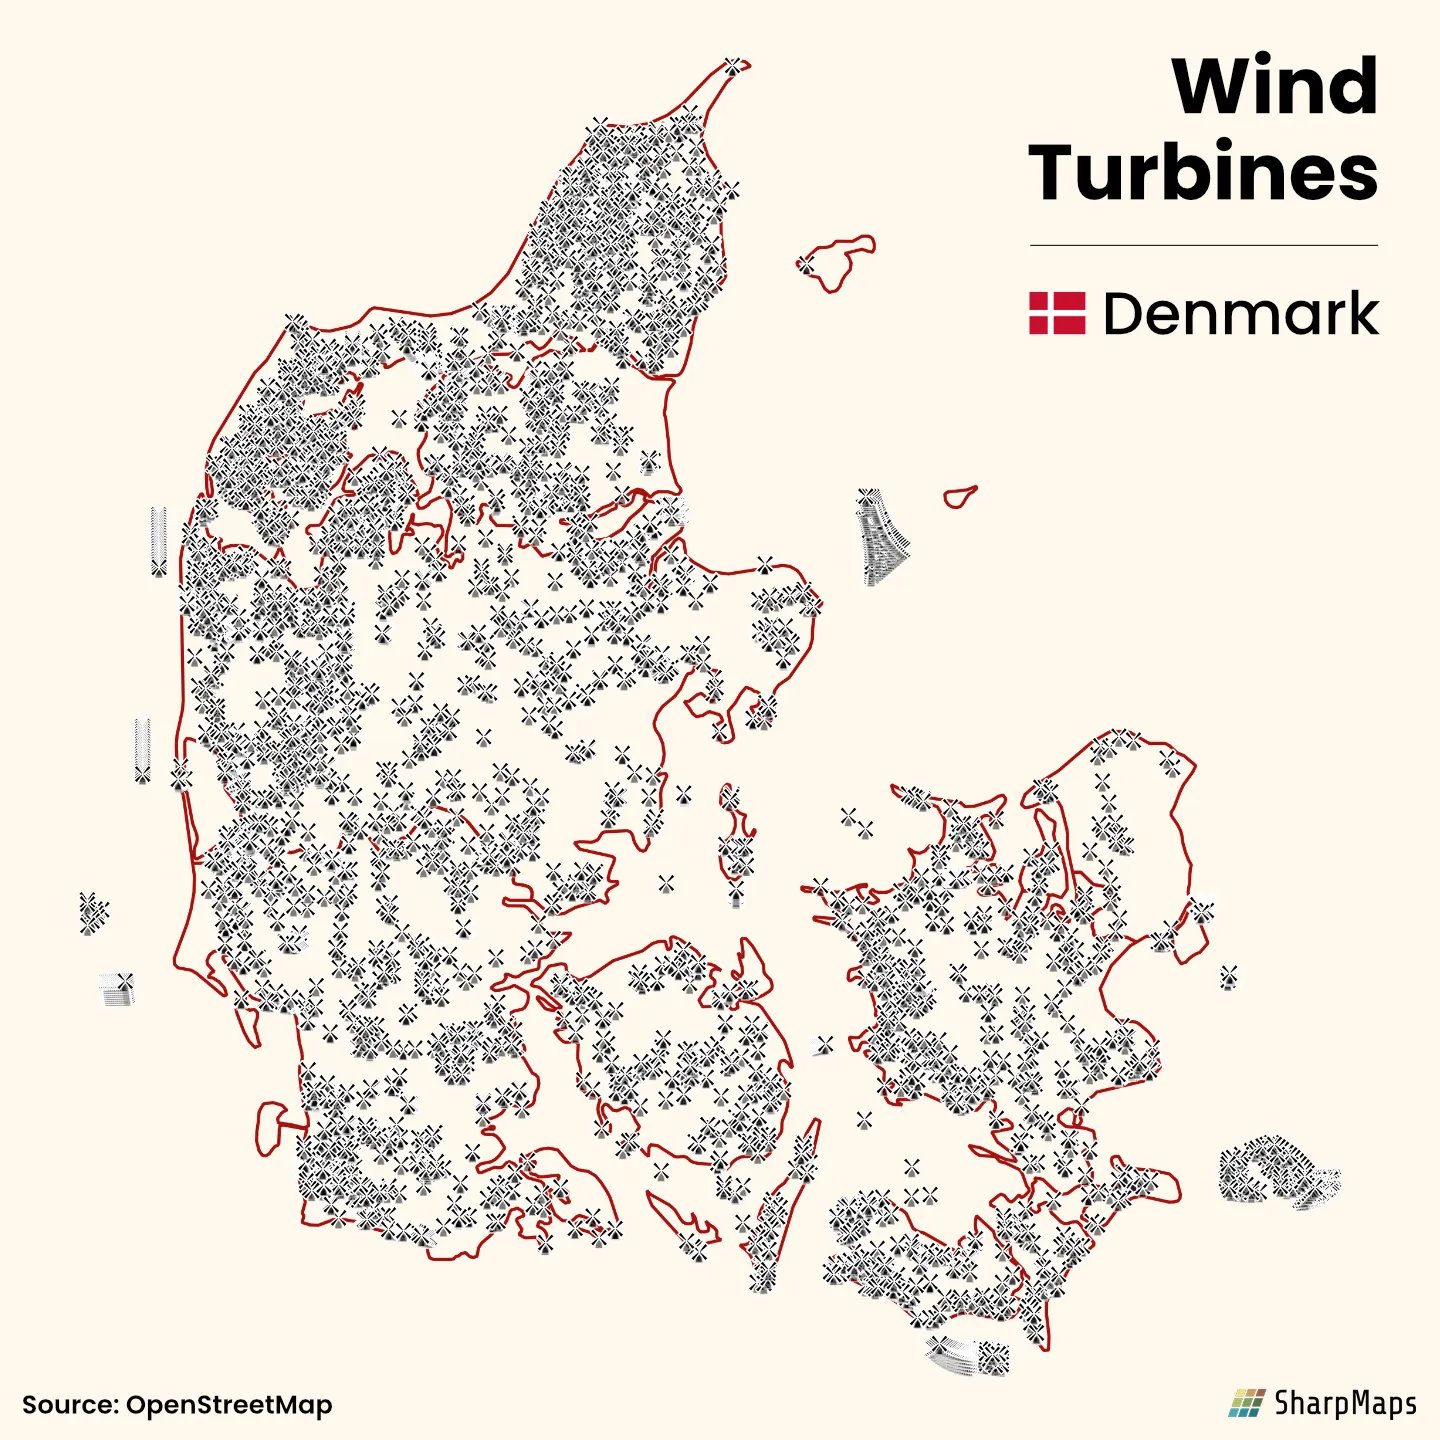
Now that we know how the data is structured, and how to inspect how the data is tagged, it is time for a first example. In this article I will make a map showing all the wind turbines in Denmark. After inspecting the data, this means we are looking for nodes, with the tag generator:source and its corresponding value wind.
A quick way to retrieve OSM data is using the Overpass API. This works by querying the online dataset directly which means that you don’t need to download any local files. The drawback is that the query language for this API has quite a steep learning curve, and that this method is only feasible to select a small amount of data.
Let’s for example retrieve all wind turbines in Denmark.
area["ISO3166-1"="DK"][admin_level=2]->.searchArea;
node["generator:source"="wind"](area.searchArea);
out skel;
The first line selects the area of Denmark, and the second line selects all nodes that are a wind turbine within this area. out skel; returns just the coordinates for the different points without any additional tags. The full reference for the query language can be found here, and I also found that ChatGPT does quite a good job at writing Overpass API queries.
Using overpass turbo
Overpass turbo is an online API client that can visualize query data, and also export it to various formats like GeoJSON files that can be used in other tools or scripts. Entering our example query here, we get the following output as a result.
Using Python
Alternatively you can use the Overpass API from Python as well. Simply by doing a HTTP GET request to the API endpoint, or easier yet, with the package OSMnx.
The code below returns all wind turbines in Denmark as a GeoDataFrame. If you don’t know what that is, read my introduction article here.
import osmnx

#Get all wind turbines within Denmark
turbines = osmnx.features.features_from_place('Denmark', {'generator:source': 'wind'} )
Working with OSM data locally
Using the overpass API is nice for small amounts of data, but if you want to query a larger dataset, it makes more sense to use an offline dataset.
The most common format you will encounter for OSM data is a .osm file or a .osm.pbf file. The first one contains all data in a plain text XML file, and the second one is a more optimized binary file format. This data can be downloaded for free for the entire planet, but also for a smaller section, such as a country, region or city. This is useful, since the pbf file for the entire planet is close to 80 GB at the moment of writing, and not easy to handle. Predefined extracts can be downloaded at Geofabrik, but you can also do this on your own.
Extracting data by region
Unless you make a full world map, you typically only need the data for a smaller region. Next to the predefined exports mentioned before, you can also use the HOT export tool as a convenient way to download OSM data for a certain region in many predefined file formats.
You can also do it locally, using a library called Osmium, either as a command line tool, or from Python. For instance to extract the Netherlands you can use the command below. The bounding box coordinates can be found using a tool like bboxfinder.
osmium extract planet.osm.pbf -b 3.0,50.7,7.3,53.8 -o netherlands.osm.pbf
Even though the complete planet is a very large file, this command finishes in a reasonable 30 minutes on my normal PC. But the main benefit is that any next steps will be much faster on this smaller file. To optimize even further, Osmium can also be used to only select data with specific tags.
Now, let’s explore various methods how we can use this data locally. We will use the same example, and attempt to plot all wind turbines in Denmark, starting from a country extract PBF file.
Working directly with the PBF file
Earlier, while extracting, data we learned that Osmium is a good library that can handle PBF files directly. Using its Python bindings, pyosmium, we can write the following example code return all wind turbines in Denmark.
import osmium as osm
import geopandas as gpd
import shapely as shp

# Define an input handler class that only selects wind turbine nodes
class WindTurbineHandler(osm.SimpleHandler):
    def __init__(self):
        osm.SimpleHandler.__init__(self)
        self.list = []

    def node(self, n):
        if 'generator:source' in n.tags and n.tags['generator:source'] == 'wind':
            self.list.append(shp.Point(n.location.lon, n.location.lat))

# Apply the input handler class to the right file
handler = WindTurbineHandler()
handler.apply_file('denmark-latest.osm.pbf', locations=True)

# Plot the points using GeoPandas
gpd.GeoSeries(handler.list).plot()
In the end, this approach is not recommended. It’s not straightforward at all, and performance is very slow. But if you really want to, now you can 😅.
Converting the data to a GeoPackage
The data formats used by OSM are designed to allow easy and flexible editing, but the requirements for reading and analysing the data are different. An easier and more performant data format to work with for reasonably sized datasets is a GeoPackage. This is a local database format, based on SQLite.
As explained in my introduction article here, the best tooling to convert geospatial file formats is called GDAL and more specifically its tool called ogr2ogr. Simply call it from the command line to convert the file to a GeoPackage.
ogr2ogr denmark.gpkg denmark-latest.osm.pbf
Now we will take this GeoPackage file and open it directly in QGIS (alternatively, we can also deal with this file from Python, as explained in my previous article).
Unfortunately when exploring the data, it turns out that many tags from the OSM data are grouped together in a single field in the database. Except for the most common tags, this is the default behaviour of ogr2ogr. Alternative configurations are discussed in the GDAL documentation. For now, I will leave this as it is, and use an SQL query in QGIS to load the correct data points.
SELECT *
FROM points
WHERE other_tags LIKE '%"generator:source"=>"wind"%'
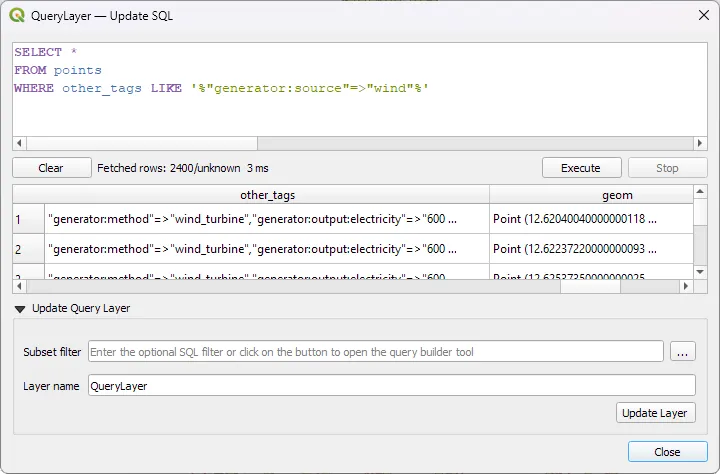
QGIS even has a built in SVG symbol of a wind mill. So with that, we can quickly build the following map. Pretty neat!
Follow Me
You can follow me on Instagram, Threads, and X. If you are interested to receive an update whenever I post new content, leave your e-mail address below.